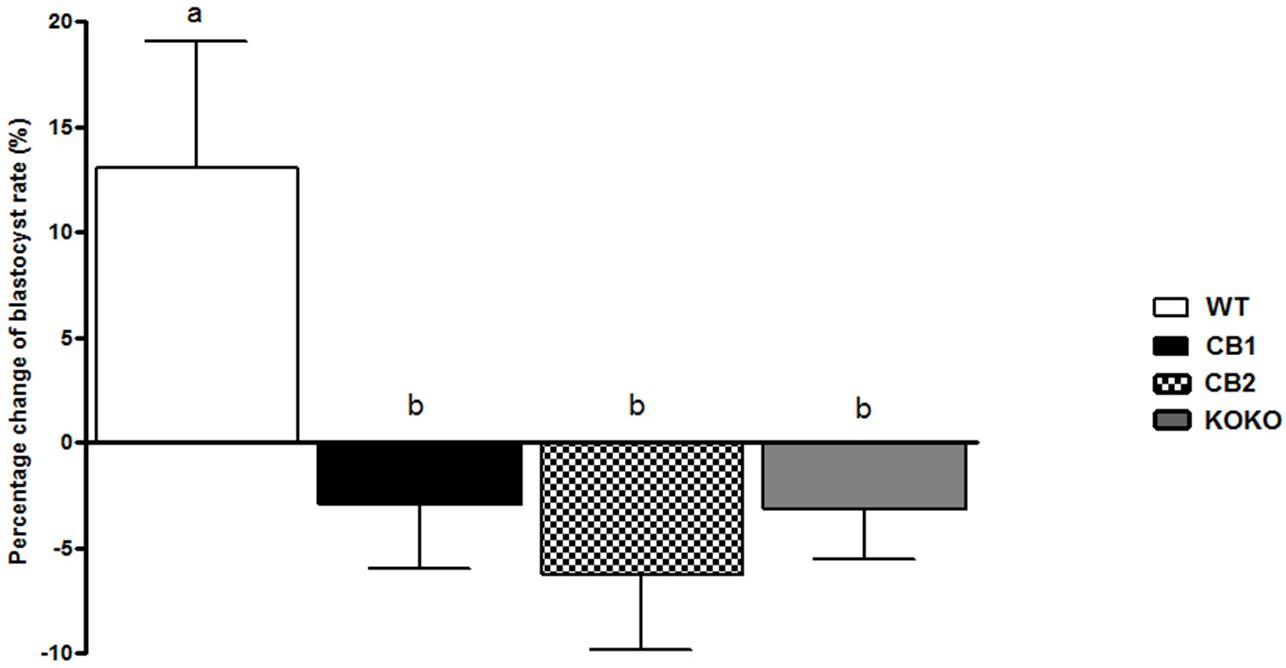
Fig. 8. Percentage change of blastocysts rate between control and treatment. Blastocysts rate changes using oocytes from wild type (WT) mice (white), Cnr1−/− mice (black), Cnr2−/− mice (dotted) and Cnr1−/−/Cnr2−/− mice (grey). Results are the mean ± SEM of 10 independent experiments. Significant differences between treatments are indicated with different letters; p<0.05 in all cases.